Thursday, December 4, 2014
Apply geographic functions in SAP Lumira to enhance your data visualization capability
This video below is showing the method to use geo-chart in SAP Lumira to display KPI in different locations. It is useful and functions well. Enjoy it.
Build your WebI report on BEx query.
Build your WebI report upon SAP Bex query
In this post, the video below will show you the method to build your WebI report upon your BEx query. Enjoy it.
Step 1: Log on to the BI LaunchPad, create a new WebI report and select BEX query as data source:


Note: Add filters in query panel to get better performance instead of adding filters in report although in our case we do not have filters needed.
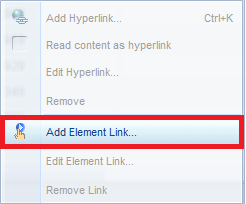
Step 4: Drag and drop the required objects to the body of the report, right click the edge of the left table (sales rep table) and add a drill down link to the sold-to-party table:


In this post, the video below will show you the method to build your WebI report upon your BEx query. Enjoy it.
Step by step description of the above video:
The purpose of this essay is to explain the method to explain in detail how to build WebI report on Bex query.
Step 1: Log on to the BI LaunchPad, create a new WebI report and select BEX query as data source:
Step 2: Select the BICS connection and query to be used
Step 3: Set variables and filters and drag and drop required objects to “Result Object” panel. Click “Run Query” button on the top right corner.
Note: Add filters in query panel to get better performance instead of adding filters in report although in our case we do not have filters needed.
Step 4: Drag and drop the required objects to the body of the report, right click the edge of the left table (sales rep table) and add a drill down link to the sold-to-party table:
Click through to the final page and choose the tables that will be connected to the left table, then click “Finish”:

Now we have built the drill down connection between the 2 parts. We can simply click any sales representative at left and see his/her customers and transactions accordingly in detail.
Step 5: Overall result comes to the top of the report so that the report viewer can easily find out the aggregated result of each object.
Note: if one column contains null values, we could use this formula and get rid of those null values:
And also if there is any requirements on data format, we could also include the requirements to our formula:
There is an easy way to do zero suppression in “format table” tab:
Step 6: Make sure that the “refresh on open” option is checked so that the report will be refreshed every time it opens.
Step 7: Adjust the format of numbers and header to make it look good.
Subscribe to:
Posts (Atom)